Set or query the plot box aspect ratio
Syntax
pbaspect
pbaspect([aspect_ratio])
pbaspect('mode')
pbaspect('auto')
pbaspect('manual')
pbaspect(axes_handle,...)
Description
The plot box aspect ratio determines the relative size of the x-, y-, and z-axes.
pbaspect
with no arguments returns the plot box aspect ratio of the current axes.
pbaspect([aspect_ratio])
[1 1 1] (the default) means the plot box is a cube (although with stretch-to-fill enabled, it may not appear as a cube). See Remarks.
pbaspect('mode')
returns the current value of the plot box aspect ratio mode, which can be either auto (the default) or manual. See Remarks.
pbaspect('auto')
sets the plot box aspect ratio mode to auto.
pbaspect('manual')
sets the plot box aspect ratio mode to manual.
pbaspect(axes_handle,...)
performs the set or query on the axes identified by the first argument, axes_handle. If you do not specify an axes handle, pbaspect operates on the current axes.
Remarks
pbaspect sets or queries values of the Axes object PlotBoxAspectRatio and PlotBoxAspectRatioMode properties.
When the plot box aspect ratio mode is auto, MATLAB sets the ratio to
[1 1 1], but may change it to accommodate manual settings of the data aspect ratio, camera view angle, or axis limits. See the Axes DataAspectRatio property for a table listing the interactions between various properties.
Setting a value for the plot box aspect ratio or setting the plot box aspect ratio mode to manual disables MATLAB's stretch-to-fill feature (stretching of the axes to fit the window). This means setting the plot box aspect ratio to its current value,
pbaspect(pbaspect)
can cause a change it the way the graphs look. See the Remarks section of the axes reference description and the "Aspect Ratio" section in the Using MATLAB Graphics manual for a discussion of stretch-to-fill.
Examples
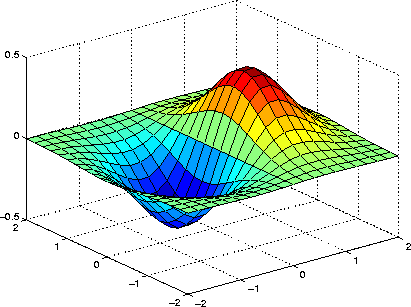
The following surface plot of the function is useful to illustrate the plot box aspect ratio. First plot the function over the range
-2  x
x  2, -2
2, -2  y
y  2,
2,
[x,y] = meshgrid([-2:.2:2]);
z = x.*exp(-x.^2 - y.^2);
surf(x,y,z)

Querying the plot box aspect ratio shows that the plot box is square:
pbaspect
ans =
     1  1  1
It is also interesting to look at the data aspect ratio selected by MATLAB:
daspect
ans =
     4  4  1
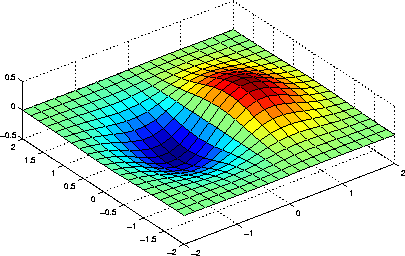
To illustrate the interaction between the plot box and data aspect ratios, set the data aspect ratio to [1 1 1] and again query the plot box aspect ratio:
daspect([1 1 1])


pbaspect
ans =
     4  4  1
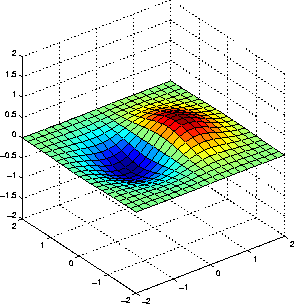
The plot box aspect ratio has changed to accommodate the specified data aspect ratio. Now suppose you want the plot box aspect ratio to be [1 1 1] as well:
pbaspect([1 1 1])

Notice how MATLAB changed the axes limits because of the constraints introduced by specifying both the plot box and data aspect ratios.
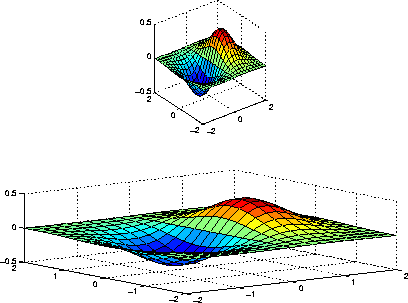
You can also use pbaspect to disable stretch-to-fill. For example, displaying two subplots in one Figure can give surface plots a squashed appearance. Disabling stretch-to-fill :
upper_plot = subplot(211);
surf(x,y,z)
lower_plot = subplot(212);
surf(x,y,z)
pbaspect(upper_plot,'manual')

See Also
axis, daspect, xlim, ylim, zlim
The Axes properties DataAspectRatio, PlotBoxAspectRatio, XLim, YLim, ZLim
The "Aspect Ratio" section in the Using MATLAB Graphics manual.
[ Previous | Help Desk | Next ]

 is useful to illustrate the plot box aspect ratio. First plot the function over the range
  x
x  2, -2
2, -2  y
y  2,
2,
