Set or query the axes data aspect ratio
Syntax
daspect
daspect([aspect_ratio])
daspect('mode')
daspect('auto')
daspect('manual')
daspect(axes_handle,...)
Description
The data aspect ratio determines the relative scaling of the data units along the x-, y-, and z-axes.
daspect
with no arguments returns the data aspect ratio of the current axes.
daspect([aspect_ratio])
x-, y-, and z-axis scaling (e.g., [1 1 3] means one unit in x is equal in length to one unit in y and three unit in z).
daspect('mode')
returns the current value of the data aspect ratio mode, which can be either auto (the default) or manual. See Remarks.
daspect('auto')
sets the data aspect ratio mode to auto.
daspect('manual')
sets the data aspect ratio mode to manual.
daspect(axes_handle,...)
performs the set or query on the axes identified by the first argument, axes_handle. When you do not specify an axes handle, daspect operates on the current axes.
Remarks
daspect sets or queries values of the Axes object DataAspectRatio and DataAspectRatioMode properties.
When the data aspect ratio mode is auto, MATLAB adjusts the data aspect ratio so that each axis spans the space available in the Figure window. If you are displaying a representation of a real-life object, you should set the data aspect ratio to [1 1 1] to produce the correct proportions.
Setting a value for data aspect ratio or setting the data aspect ratio mode to manual disables MATLAB's stretch-to-fill feature (stretching of the axes to fit the window). This means setting the data aspect ratio to a value, including its current value,
daspect(daspect)
can cause a change in the way the graphs look. See the Remarks section of the axes function description and the "Aspect Ratio" section in the Using MATLAB Graphics manual for more information.
Examples
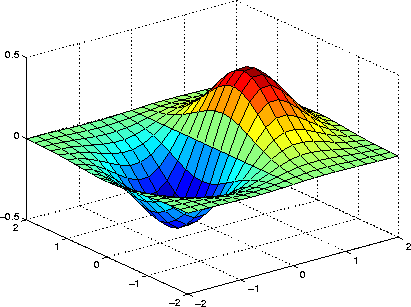
The following surface plot of the function is useful to illustrate the data aspect ratio. First plot the function over the range -2
  x
x  2, -2
2, -2  y
y  2,
2,
[x,y] = meshgrid([-2:.2:2]);
z = x.*exp(-x.^2 - y.^2);
surf(x,y,z)

Querying the data aspect ratio shows how MATLAB has drawn the surface:
daspect
ans =
     4  4  1
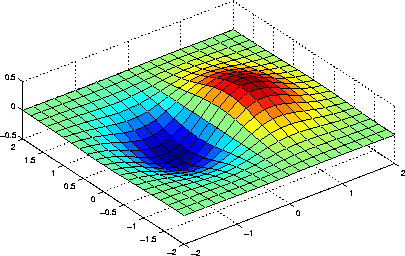
Setting the data aspect ratio to [1 1 1] produces a surface plot with equal scaling alone each axis:
daspect([1 1 1])

See Also
axis, pbaspect, xlim, ylim, zlim
The Axes properties DataAspectRatio, PlotBoxAspectRatio, XLim, YLim, ZLim
The "Aspect Ratio" section in the Using MATLAB Graphics manual.
[ Previous | Help Desk | Next ]

 is useful to illustrate the data aspect ratio. First plot the function over the range -2
  x
x  2, -2
2, -2  y
y  2,
2,