Set or query axis limits
Syntax
Note that the syntax for each of these three functions is the same; only the xlim function is used for simplicity. Each operates on the respective x-, y-, or z-axis.
xlim
xlim([xmin xmax])
xlim('mode')
xlim('auto')
xlim('manual')
xlim(axes_handle,...)
Description
xlim
with no arguments return the respective limits of the current axes.
xlim([xmin xmax])
sets the axis limits in the current axes to the specified values.
xlim('mode')
returns the current value of the axis limits mode, which can be either auto (the default) or manual.
xlim('auto')
sets the axis limit mode to auto.
xlim('manual')
sets the respective axis limit mode to manual.
xlim(axes_handle,...)
performs the set or query on the axes identified by the first argument, axes_handle. When you do not specify an axes handle, these functions operate on the current axes.
Remarks
xlim, ylim, and zlim set or query values of the Axes object XLim, YLim, ZLim, and XLimMode, YLimMode, ZLimMode properties.
When the axis limit modes are auto (the default), MATLAB uses limits that span the range of the data being displayed and are round numbers. Setting a value for any of the limits also sets the corresponding mode to manual. Note that high-level plotting functions like plot and surf reset both the modes and the limits. If you set the limits on an existing graph and want to maintain these limits while adding more graphs, use the hold command.
Examples
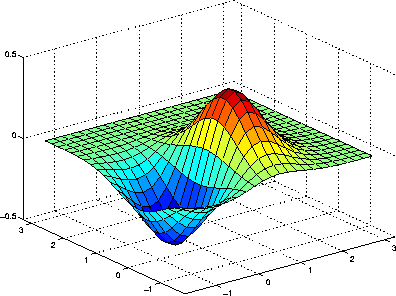
This example illustrates how to set the x- and y-axis limits to match the actual range of the data, rather than the rounded values of [-2 3] for the x-axis and [-2 4] for the y-axis originally selected by MATLAB.
[x,y] = meshgrid([-1.75:.2:3.25]);
z = x.*exp(-x.^2-y.^2);
surf(x,y,z)
xlim([-1.75 3.25])
ylim([-1.75 3.25])

See Also
axis
The Axes properties XLim, YLim, ZLim
The "Aspect Ratio" section in the Using MATLAB Graphics manual.
[ Previous | Help Desk | Next ]
