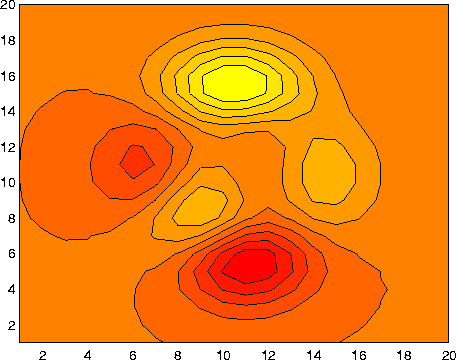
Filled two-dimensional contour plot
Syntax
contourf(Z)
contourf(Z,n)
contourf(Z,v)
contourf(X,Y,Z)
contourf(X,Y,Z,n)
contourf(X,Y,Z,v)
[C,h,CF] = contourf(...)
Description
A filled contour plot displays isolines calculated from matrix Z and fills the areas between the isolines using constant colors. The color of the filled areas depends on the current Figure's colormap.
contourf(Z)
draws a contour plot of matrix Z, where Z is interpreted as heights with respect to a plane. Z must be at least a 2-by-2 matrix. The number of contour lines and the values of the contour lines are chosen automatically.
contourf(Z,n)
draws a contour plot of matrix Z with n contour levels.
contourf(Z,v)
draws a contour plot of matrix Z with contour levels at the values specified in vector v.
contourf(X,Y,Z), contourf(X,Y,Z,n), and contourf(X,Y,Z,v)
produce contour plots of Z using X and Y to determine the x- and y-axis limits. When X and Y are matrices, they must be the same size as Z, in which case they specify a surface as surf does.
[C,h,CF] = contourf(...)
returns the contour matrix C as calculated by the function contourc and used by clabel, a vector of handles h to Patch graphics objects, and a contour matrix CF for the filled areas.
Remarks
If X or Y is irregularly spaced, contourf calculates contours using a regularly spaced contour grid, then transforms the data to X or Y.
Examples
Create a filled contour plot of the peaks function:
[C,h] = contourf(peaks(20),10);
colormap autumn

See Also
clabel, contour, contour3, contourc, quiver
[ Previous | Help Desk | Next ]
