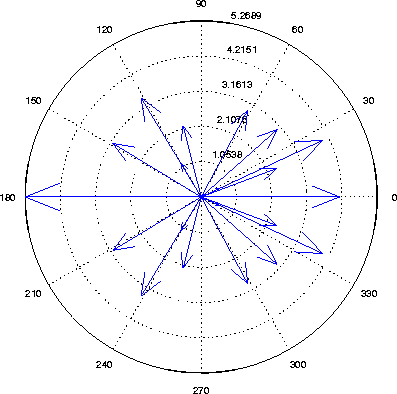
Plot arrows emanating from the origin
Syntax
compass(X,Y)
compass(Z)
compass(...,LineSpec)
h = compass(...)
Description
A compass plot displays direction or velocity vectors as arrows emanating from the origin. X, Y, and Z are in Cartesian coordinates and plotted on a circular grid.
compass(X,Y)
displays a compass plot having n arrows, where n is the number of elements in X or Y. The location of the base of each arrow is the origin. The location of the tip of each arrow is a point relative to the base and determined by [X(i),Y(i)].
compass(Z)
displays a compass plot having n arrows, where n is the number of elements in Z. The location of the base of each arrow is the origin. The location of the tip of each arrow is relative to the base as determined by the real and imaginary components of Z. This syntax is equivalent to compass(real(Z),imag(Z)).
compass(...,LineSpec)
draws a compass plot using the line type, marker symbol, and color specified by LineSpec.
h = compass(...)
returns handles to Line objects.
Examples
Draw a compass plot of the eigenvalues of a matrix:
Z = eig(randn(20,20));
compass(Z)

See Also
feather, LineSpec, rose
[ Previous | Help Desk | Next ]
