Plot velocity vectors
Syntax
feather(U,V)
feather(Z)
feather(...,LineSpec)
Description
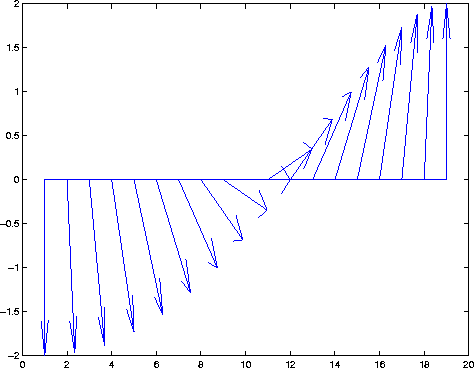
A feather plot displays vectors emanating from equally spaced points along a horizontal axis. You express the vector components relative to the origin of the respective vector.
feather(U,V)
displays the vectors specified by U and V, where U contains the x components as relative coordinates, and V contains the y components as relative coordinates.
feather(Z)
displays the vectors specified by the complex numbers in Z. This is equivalent to feather(real(Z),imag(Z)).
feather(...,LineSpec)
draws a feather plot using the line type, marker symbol, and color specified by LineSpec.
Examples
Create a feather plot showing the direction of theta:
theta = (-90:10:90)*pi/180;
r = 2*ones(size(theta));
[u,v] = pol2cart(theta,r);
feather(u,v);

See Also
compass, LineSpec, rose
[ Previous | Help Desk | Next ]
