Plot three-dimensional discrete sequence data
Syntax
stem3(Z)
stem3(X,Y,Z)
stem3(...,'fill')
stem3(...,LineSpec)
h = stem3(...)
Description
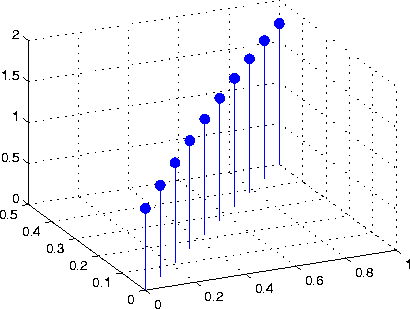
Three-dimensional stem plots display lines extending from the xy-plane. A circle (the default) or other marker symbol whose z-position represents the data value, terminates each stem.
stem3(Z)
plots the data sequence Z as stems that extend from the xy-plane.
x and y are generated automatically. When Z is a row vector, stem3 plots all elements at equally spaced x values against the same y value. When Z is a column vector, stem3 plots all elements at equally spaced y values against the same x value.
stem3(X,Y,Z)
plots the data sequence Z at values specified by X and Y. X, Y, and Z must all be vectors or matrices of the same size.
stem3(...,'fill')
specifies whether to color the interior of the circle at the end of the stem.
stem3(...,LineSpec)
specifies the line style, marker symbol, and color for the stems. See LineSpec for more information.
h = stem3(...)
returns handles to Line graphics objects.
Examples
Create a three-dimensional stem plot to visualize a function of two variables:
X = linspace(0,1,10);
Y = X./2;
Z = sin(X) + cos(Y);
stem3(X,Y,Z,'fill')
view(-25,30)
:

See Also
bar, plot, stairs, stem
[ Previous | Help Desk | Next ]

