Ribbon plot
Syntax
ribbon(Y)
ribbon(X,Y)
ribbon(X,Y,width)
h = ribbon(...)
Description
ribbon(Y)
plots the columns of Y as separate three-dimensional ribbons using
X = 1:size(Y,1).
ribbon(X,Y)
plots X versus the columns of Y as three-dimensional strips. X and Y are vectors of the same size or matrices of the same size. Additionally, X can be a row or a column vector, and Y a matrix with length(X) rows.
ribbon(X,Y,width)
specifies the width of the ribbons. The default is 0.75.
h = ribbon(...)
returns a vector of handles to Surface graphics objects. ribbon returns one handle per strip.
Examples
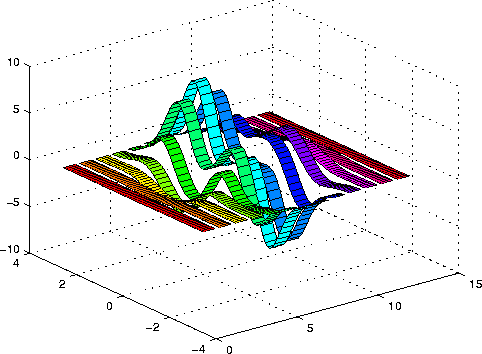
Create a ribbon plot of the peaks function:
[x,y] = meshgrid(-3:.5:3,-3:.1:3);
z = peaks(x,y);
ribbon(y,z)
colormap hsv

See Also
plot, plot3, surface
[ Previous | Help Desk | Next ]

