Log-log scale plot
Syntax
loglog(Y)
loglog(X1,Y1,...)
loglog(X1,Y1,LineSpec,...)
loglog(...,'PropertyName',PropertyValue,...)
h = loglog(...)
Description
loglog(Y)
plots the columns of Y versus their index if Y contains real numbers. If Y contains complex numbers, loglog(Y) and loglog(real(Y),imag(Y)) are equivalent. loglog ignores the imaginary component in all other uses of this function.
loglog(X1,Y1,...)
plots all Xn versus Yn pairs. If only Xn or Yn is a matrix, loglog plots the vector argument versus the rows or columns of the matrix, depending on whether the vector's row or column dimension matches the matrix.
loglog(X1,Y1,LineSpec,...)
plots all lines defined by the Xn,Yn,LineSpec triples, where LineSpec determines line type, marker symbol, and color of the plotted lines. You can mix Xn,Yn,LineSpec triples with Xn,Yn pairs, for example,
loglog(X1,Y1,X2,Y2,LineSpec,X3,Y3)
loglog(...,'PropertyName',PropertyValue,...)
sets property values for all Line graphics objects created by loglog. See the line reference page for more information.
h = loglog(...)
returns a column vector of handles to Line graphics objects, one handle per Line.
Remarks
If you do not specify a color when plotting more than one Line, loglog automatically cycles through the colors and line styles in the order specified by the current Axes.
Examples
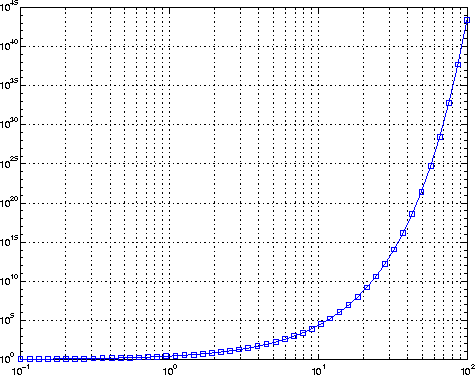
Create a simple loglog plot with square markers:
x = logspace(-1,2);
loglog(x,exp(x),'-s')
grid on

See Also
line, LineSpec, plot, semilogx, semilogy
[ Previous | Help Desk | Next ]
