Area fill of a two-dimensional plot
Syntax
area(Y)
area(X,Y)
area(...,ymin)
area(...,'PropertyName',PropertyValue,...)
h = area(...)
Description
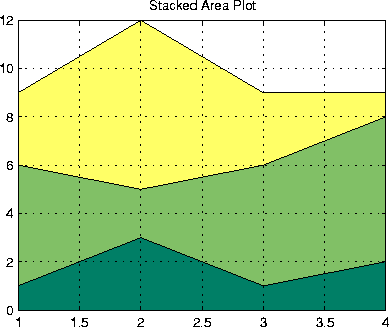
An area plot displays elements in Y as one or more curves and fills the area beneath each curve. When Y is a matrix, the curves are stacked showing the relative contribution of each row element to the total height of the curve at each x interval.
area(Y)
plots the vector Y or the sum of each column in matrix Y. The x-axis automatically scales depending on length(Y) when Y is a vector, and on size(Y,1)when Y is a matrix.
area(X,Y)
plots Y at the corresponding values of X. If X is a vector, length(X) must equal length(Y) and X must be monotonic. If X is a matrix, size(X) must equal size(Y) and each column in X must be monotonic. To make a vector or matrix monotonic, use sort.
area(...,ymin)
specifies the lower limit in the y direction for the area fill. The default ymin is 0.
area(...,'PropertyName',PropertyValue,...)
specifies property name and property value pairs for the Patch graphics object created by area.
h = area(...)
returns handles of Patch graphics objects. area creates one Patch object per column in Y.
Remarks
area creates one curve from all elements in a vector or one curve per column in a matrix. The colors of the curves are selected from equally spaced intervals throughout the entire range of the colormap.
Examples
Plot the values in Y as a stacked area plot:
Y = [   1, 5, 3;
        3, 2, 7;
        1, 5, 3;
        2, 6, 1];
area(Y)
grid on
colormap summer
set(gca,'Layer','top')
title 'Stacked Area Plot'

See Also
plot
[ Previous | Help Desk | Next ]

