Function plotter.
Syntax
ezplot(f)
ezplot(f,[xmin xmax])
ezplot(f,[xmin xmax],fign)
Description
ezplot(f) plots a graph of f, where f is a symbolic expression representing a function of one variable. By default, ezplot plots f over an appropriate domain and range (see below).
ezplot(f,[xmin xmax]) plots f over the specified domain. It opens and displays the result in a window labeled Figure No. 1. If any plot windows are already open, ezplot displays the result in the highest numbered window.
ezplot(f,[xmin xmax],fign) opens (if necessary) and displays the plot in the window labeled fign.
Examples
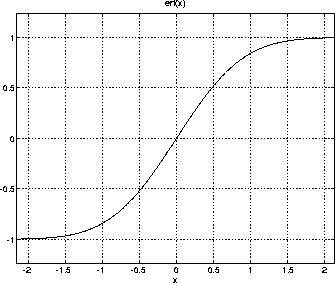
The following statements:
syms x
ezplot(erf(x))
grid
plot a graph of the error function:

Algorithm
If you do not specify a plot range, ezplot samples the function between -2*pi and 2*pi and selects a subinterval where the variation is significant as the plot domain. For the range, ezplot omits extreme values associated with singularities.
See Also
syms
[ Previous | Help Desk | Next ]

