| MATLAB Function Reference | Search Help Desk |
| voronoi | Examples See Also |
voronoi(x,y) voronoi(x,y,TRI) h = voronoi(...,'LineSpec') [vx,vy] = voronoi(...)Consider a set of coplanar points
 For each point
  in the set
  you can draw a boundary enclosing all the intermediate points lying closer to
  than to other points in the set
  Such a boundary is called a Voronoi polygon, and the set of all Voronoi polygons for a given point set is called a Voronoi diagram.
voronoi(x,y)
plots the Voronoi diagram for the points x,y.
voronoi(x,y,TRI)
uses the triangulation TRI instead of computing it via delaunay.
h = voronoi(...,'LineSpec')
plots the diagram with color and line style specified and returns handles to the line objects created in h.
[vx,vy] = voronoi(...)
returns the vertices of the Voronoi edges in vx and vy so that plot(vx,vy,'-',x,y,'.') creates the Voronoi diagram.
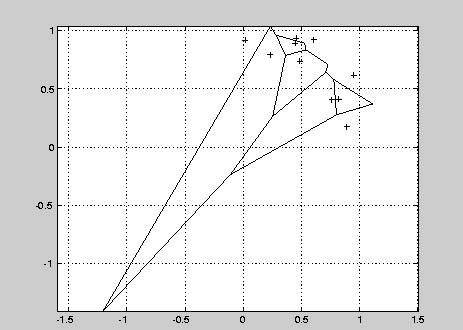
This code plots the Voronoi diagram for 10 randomly generated points.
rand('state',0);
x = rand(1,10); y = rand(1,10);
[vx, vy] = voronoi(x,y);
plot(x,y,'r+',vx,vy,'b-'); axis equal

The LineSpec entry inUsing MATLAB Graphics, and
convhull Convex hull
delaunay Delaunay triangulation
dsearch Search for nearest point