Pie chart
Syntax
pie(X)
pie(X,explode)
h = pie(...)
Description
pie(X)
draws a pie chart using the data in X. Each element in X is represented as a slice in the pie chart.
pie(X,explode)
offsets a slice from the pie. explode is a vector or matrix of zeros and nonzeros that correspond to X. A non-zero value offsets the corresponding slice from the center of the pie chart, so that X(i,j) is offset from the center if explode(i,j) is nonzero. explode must be the same size as X.
h = pie(...)
returns a vector of handles to Patch and Text graphics objects.
Remarks
The values in X are normalized via X/sum(X) to determine the area of each slice of the pie. If sum(X)
1, the values in X directly specify the are of the pie slices. MATLAB draws only a partial pie if sum(X)<1.
Examples
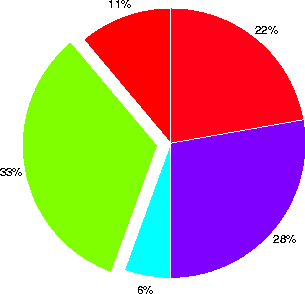
Emphasize the second slice in the chart by setting its corresponding explode element to 1:
x = [1 3 0.5 2.5 2];
explode = [0 1 0 0 0];
pie(x,explode)
colormap jet

See Also
pie3
[ Previous | Help Desk | Next ]

