The Macintosh m-file debugger provides graphical m-file debugging services.
The toolbar's buttons provide the following capabilities:
| Open a file in the debugger. | |
| Single step; execute the current line of m code. | |
| Step in; step into the current line's function call if there is one. Otherwise execute the current line of m code. | |
| Step out; continue execution until the current function is exited. | |
| Go; continue execution until a breakpoint is encountered or until returning to the prompt. | |
| Exit; quit debug mode. | |
| Find text in the current window. | |
| Go to a specific line number. | |
| Open this file in the m-file editor. | |
| Pop up a list of subfunctions in this m-file. Select a subfunction from the popup to scroll to that function. | |
| Pop up a list containing the calling stack. Choose a function from the popup to switch to that stack frame. | |
| Indicates that modifications cannot be made to this file in the m-file debugger; click on the editor button to make changes. |
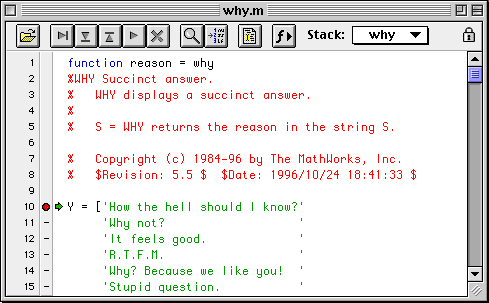
The green arrow to the left of the text shows the next line to be executed. The column between the line numbers and the text shows which lines are candidates for breakpoints. A red dot next to a line indicates that a breakpoint has been set at that line. Clicking on a the red dot will remove the breakpoint, while clicking on a dash sets a breakpoint. Note that a dash indicates that a line contains code, but that a breakpoint may not actually be set on that line. For example, line 14 in the figure above contains part of the definition of the Y variable. Clicking on the dash for line 14, however, will set a breakpoint on line 20, since that is the next executable line.
Arbitrary expressions may be evaluated by hiliting the text in the editor window and pressing the Enter key. The expression will be echoed to the command window, as will any output the expression generates.
The m-file debugger is "live"; breakpoints added or deleted via the command line cause the debugger window to update automatically.
The debugger contains two menus (Debug and Breakpoints) that direct debugging services.
The Debug menu's items mainly provide menu and command-key access to the corresponding toolbar button, with the exception of the "Go Until Here" item. Placing the cursor on a line of m code in the debugger and choosing "Go Until Here" sets a temporaray breakpoint at that item and continues execution until that line is reached. A shortcut for this is to option-click on the breakpoint dash next to a line.
The Breakpoints menu allows you to clear all current breakpoints, and set breakpoints on various error conditions.